Climate and plague in pre-industrial Europe
Prof. LEE Fung, Harry
Previous studies on the connection between climate and plague were mostly conducted without considering the influence of large-scale atmospheric circulations and long-term historical observations. The current study seeks to reveal the sophisticated role of climatic control on plague by investigating the combined effect of North Atlantic Oscillation (NAO) and temperature on plague outbreaks in Europe from 1347–1760 CE. Moving correlation analysis is applied to explore the non-linear relationship between NAO and plague transmission over time. Also, we apply the cross-correlation function to identify the role of temperature in mediating the NAO-plague connection and the lead-lag relationship in between. Our statistical results show that the pathway from climate change to plague incidence is distinctive in its spatial, temporal, and non-linear patterns. The multi-decadal temperature change exerted a 15–22 years lagged impact on the NAO-plague correlation in different European regions. The NAO-plague correlation in Atlantic-Central Europe primarily remained positive, while the correlation in Mediterranean Europe switched between positive and negative alternately. The modulating effect of temperature over the NAO-plague correlation increases exponentially with the magnitude of the temperature anomaly, but the effect is negligible between 0.3 and –0.3°C anomaly. Our findings show that a lagged influence from the temperature extremes dominantly controls the correlation between NAO and plague incidence. A forecast from our study suggests that large-scale plague outbreaks are unlikely to happen in Europe if NAO remains at its current positive phase during the earth’s future warming.
|
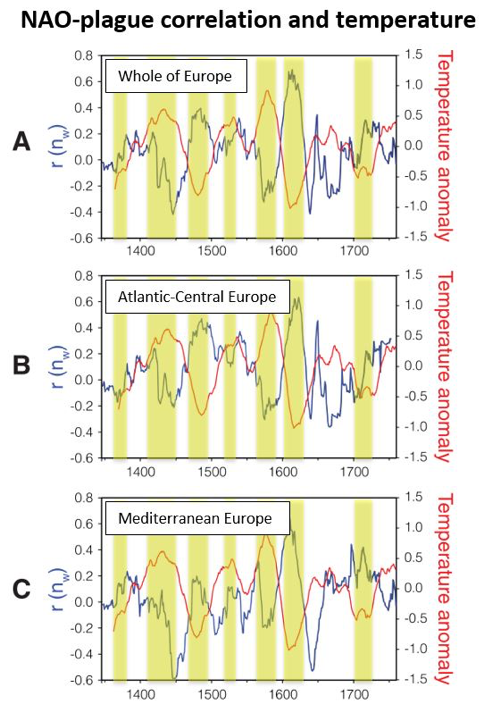
Best-fitted model between NAO-plague dynamics and lagged temperature anomaly according to the cross-correlation function. (A) Europe; (B) Atlantic-Central Europe; and (C) Mediterranean Europe. The blue lines represent the 31-year moving correlation between NAO and plague dynamics in each region. The red lines represent the corresponding temperature anomaly at the lagged position according to the cross-correlation function. The temperature anomaly time-series are smoothed by the 31-year running average. The yellow shades indicate the periods in which the temperature anomaly exceeding the threshold range between 0.3°C and –0.3°C. |