Mapping multi-layered mangrove forest from multispectral, hyperspectral and LiDAR data
冯通教授
Understanding species distribution and canopy structure of mangrove forests is imperative for flora and fauna conservation in mangrove communities. However, most of the mangrove studies only focused on the upper canopy species classification without the exploration of vertical structure of mangroves. This study presents multi-layered mangrove mapping that was accomplished by understory detection and species classification from multispectral WorldView-3 (WV-3) data, airborne hyperspectral images (HSI) and LiDAR data. First, LiDAR returns were stratified into the overstory and understory by analyzing the vertical distribution of LiDAR returns to map the understory distribution. After that, three classification algorithms Random Forest (RF), Support Vector Machine (SVM) and Convolutional Neural Network (CNN) were compared with WV-3, HSI, LiDAR data and their combination for species mapping. Feature selection was conducted prior to classification to determine the important features and optimal feature size. The canopy vertical stratification result showed the success of LiDAR data and proposed procedure for understory detection acquiring correlation coefficient of 0.71 between measured and estimated understory canopy heights. Combining spectral features and LiDAR features greatly improved the classification with accuracy from 0.836 – 0.893. CNN algorithms coupled with combination data generated the best accuracy (0.875 – 0.893), while the RF algorithm was the most efficient with satisfactory accuracy (0.838 – 0.870). The results of this study highlight that (1) the knowledge of vertical stratification provided irreplaceable information for species classification; (2) the combination of spectral and structural features improved the species classification, while features derived from LiDAR data were considered more important that spectral features; (3) Even though the advantage of HSI red edge wavelengths was revealed for species identification, low-cost WV-3 data with advanced algorithms could be alternative source to achieve accurate species classification.
Qiaosi Li, Frankie Kwan Kit Wong and Tung Fung
|
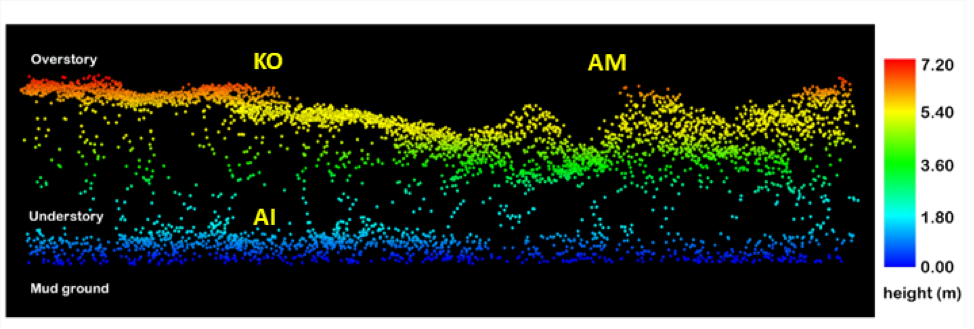
The illustration of mangrove vertical profile produced from LiDAR data. |
|
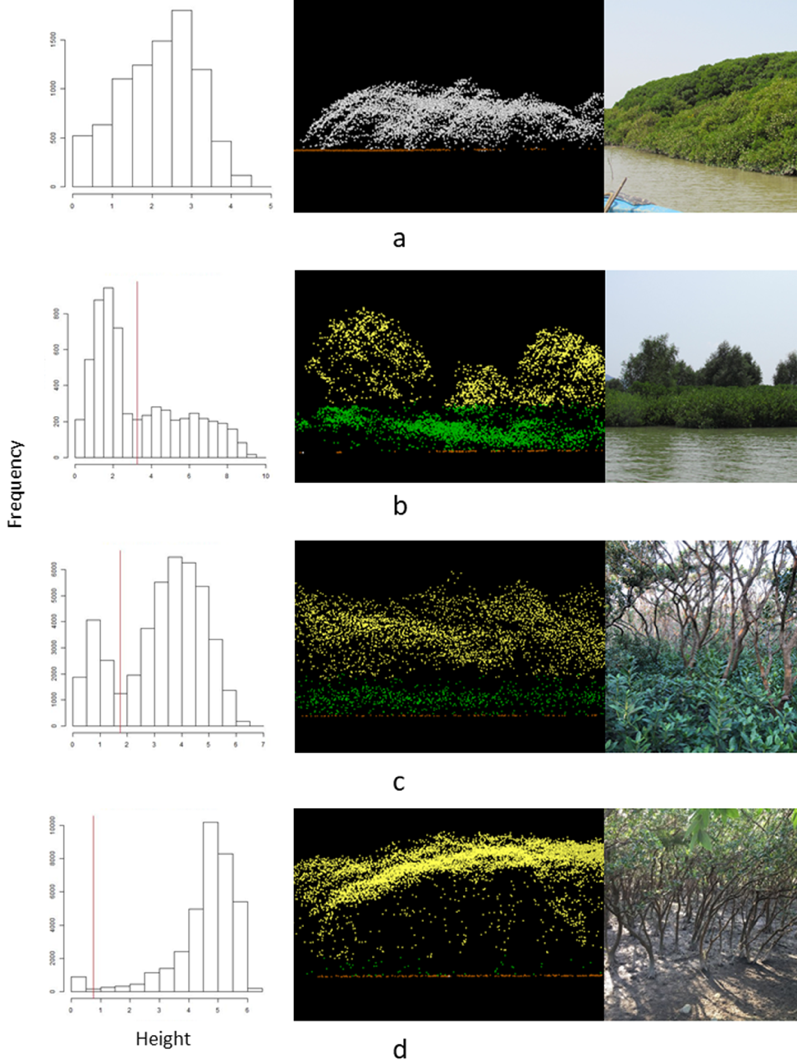
Examples of objects’ height histogram, selected height threshold, the vertical profile of LiDAR returns (white point: single layer vegetation, yellow point: high vegetation, green point: low vegetation, brown point: ground) and field photo. |